


Future of EV Market & Its Implications on Economy
Surendra Bansal
Ms (Automation & Robotics – Univ of Toronto)
Director – AUMA Industrial Group, Canada
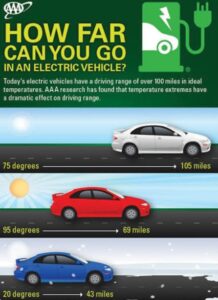
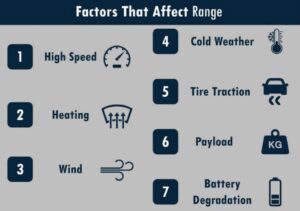
A. Factors affecting the driving range of E Vehicles.
- Temperature – Extreme outside temperatures- either hot of cold or any variation from the mean room temperature most passengers are comfortable at means the vehicle has either to be heated or cooled both of which involve considerable drawing of power from battery to maintain comfortable temperature. The reduction due to cold weather outside ( 20 deg F ) is around 12% of driving range which when taken in conjuction with other reducing factors like speed, terrain and state of roads the range can indeed become reduce considerably thus affecting purchasing decisions.
- Acceleration – Higher acceleration means higher drawing of power due to drag and higher speed also means higher power consumption thereby reducing the driving range. The approximate reduction in range at speeds higher than 65 mph to 75 mph is around 15%.
- Terrain – based on whether the vehicle is driver in hilly or flat area the driving range can reduce considerably if the vehicle operates in hilly areas.
- Urban Vs Highway – City driving versus Highway drive. Surprisingly EV vehicles are more efficient in city driving as regenerative braking is used wherein energy spent in braking is saved in form of power. So urban driving under suitable conditions can increase the driving range.
- Payload – Hauling heavy loads obviously will lead to lower driving range but since it also increases a number of other factors the driving range of vehicles requiring larger tonnage is decreased substantially.
- Wind – Headwind against the vehicle causes it to face traction and thereby require more energy to move and thus reducing the range just like it would for an ICE engine but more perceptible due to lower energy storage in vehicle.
- Battery degradation – It is measures to be in range of 2% per year thereby reducing the drivin range by over 25% in 10 years.
B. Market statistics -10 key statistics regarding Electric Vehicles.
 1. Electric cars currently constitute less than 1% of the total cars on the roads and this includes both all electric and hybrid cars.2. The % of cars sold in 2020 which were electric is over 4.6%.
- The number of electric cars on the roads is over 10 million worldwide.
- The global sales of passenger vehicles declined by 14% whereas EV vehicles increased by 39% to 39 millions unit.
5. India will require 0.4 million charging stations for 2 million EVs in another 5 years meaning at least 80000 charging stations have to be added each year.
- EV market in India will reach a sales of $206 billoom or 16 lac crores by the year 2030 and it will require an investment of over $180 billion or 13.5 lac cr.
- The EV market in India is expected to grow by a significant 36% CAGR there by creating value along the entire chain of manufacturing of parts and batteries, assembly, distribution, charging & maintenance.
- EV sales of buses in India increased by 50% in 2020 whereas sales of EV 2 wheelers has increased by 21%. Market for EV cars though registered a decline of 5%.
- Projections for sales penetration of EV vehicles in India by 2030 are a significant 30% market share for private cars, 40% for buses, 70% for commercial cars and 80% for 2 wheelers.
- The number of EV vehicles sold in India in Jan 2021 was 15910 units. The annual sales of vehicles in India in 2020 was a. Cars – 3400, Buses – 600 and 2 wheelers – 152000. The growth of these numbers over next 10 years is huge and will indeed entirely change the way India moves in the next 10 years making the country less dependent on imported fuels and reducing carbon emissions by about 0.85 bil tonne of CO2 over the vehicles lifetimes. This in turn save 474 mil tonnes of oil valued at over$207 billion.C. EV becoming a drive for Rural growth & Higher penetration of vehicles ownership.EV vehicles can become a driver of rural growth and thereby increase both rural employment and rural demand due to a combination of lower running cost & easier assembly plants.
- Vehicles are easier to assemble compared to manufacturing of conventional vehicles.
- Lower cost of operations by a factor of 5-7 in comparison with ICE vehicles thereby leading to significant shift in primary source of power for transport. Rural workers usually are unable to afford high cost of fuel thereby reducing travel and use of vehicles which with cost per km coming down by 650% will lead to significant investment in vehicles by rural farmers and workers.
- Lower maintenance cost due to less moving parts and lower wear and tear overall of vehicle also allows more rural workers to adopt as life cycle costs are important to all buyers but low income group is more sensitive to high maintenance of ICE vehicles.
- Less noise while operating thus reducing noise on the roads and cities and integrating in rural peaceful settings more easily. While it is not a decision in the purchase, policy making in cities and rural areas both will eventually require people to adopt less air polluting EV vehicles which also reduces noise and dust on the roads.
No exhaust pollution thus significantly reducing air pollution in cities and roads.
5. Skills required to manufacture and assemble an ICE vehicle is certainly more than a simpler electric vehicle and also the time for training is reduced. This will play a factor in scaling of production and production in rural areasC. Ev becoming a driver for Rural growth &

